Climate change as the main driver towards renewable energy
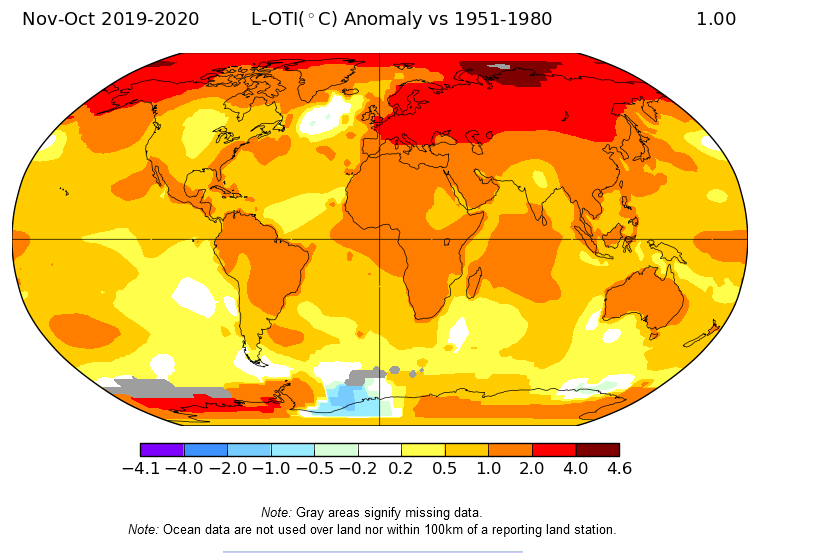
Our daily lives are heavily dependent on energy, which usually has its primal origin in the sun. The sunlight is the focal ingredient for the photosynthesis, which makes crops and plants grow, and which in turn nourishes both human beings and animals. In addition, oil and gas resources are products of organic materials that require solar radiation. The challenge with energy production is how to do it without damaging the environment and especially how to avoid greenhouse gas emissions. Unfortunately, all energy production forms have their environmental impact and even hydro- and wind power have some carbon dioxide (CO2) emissions during the construction phase. The increasing amounts of CO2 and methane (CH4) in our atmosphere cause global warming and that has been especially dramatic in the northern hemisphere (Adames et al., 2017; EPA, 2017). In the years 2019-2020 the annual (Nov-Oct) average temperature in the North Pole was 3, 1 Celsius above the base period of 1951- 1980 (Figure 1). In the recent years there has been also increasing temperatures in theAntarctic area, which might also lead to a significant rise of the sea level.
Actions against the global warming within the European energy production
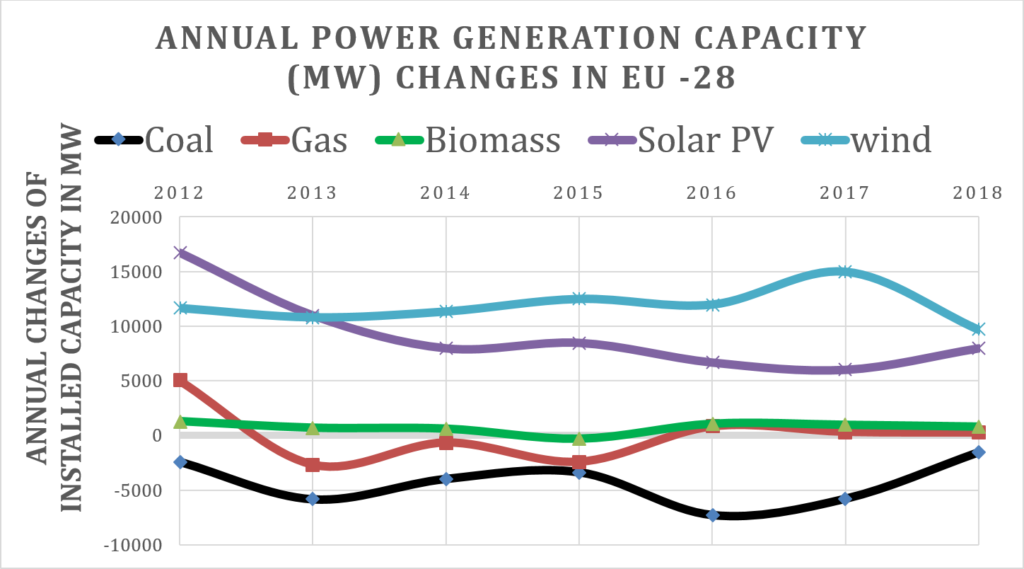
To avoid the consequences (e.g. drought in agricultural areas, rise of sea level, environmental refugees) of rising temperatures great emphasis has been put on renewable energy resources. The creation of the national energy policy has usually three main criteria; security of the energy supply, environmental aspects and economics. European countries and European Union have taken actions for several decades to fight against the global warming and share of the renewables in the production portfolio has been increasing heavily within the EU-28 countries (figure 2).
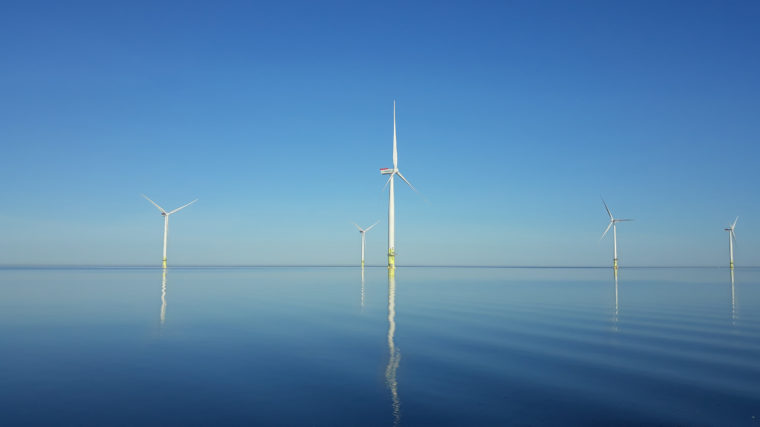
Two most rapidly growing renewable energy resources both globally and in Europe are wind power and Photovoltaic (PV) solar energy. Renewable energy accounted for 86% of all new EU power installations in 2016 wherein wind power had a major role with 51% (12 490 MW). Solar PV made up 27, 4% (6 700 MW) and natural gas as a fossil fuel was third with the installed production capacity of(12,7% / 3 115 MW) (Pineda and Tardieu, 2017). This energy transition from fossil fuels towards renewables is influencing the whole energy process, including energy transmission and consumption. Production of wind and solar energy fluctuates depending on the changing weather and diurnal conditions. In the traditional production mix of fossil fuels, hydro and nuclear power, the energy production has been adjusted according to the energy demand. Due the rapid growth of wind and solar power the paradigm has been changed to the opposite; the consumption has to fluctuate according to the production capacity. To solve this dilemma different kind of smart grid, smart city and smart service systems have been created (Barile, S., Police, F. 2010).
Smart grid Research and Development (R&D)
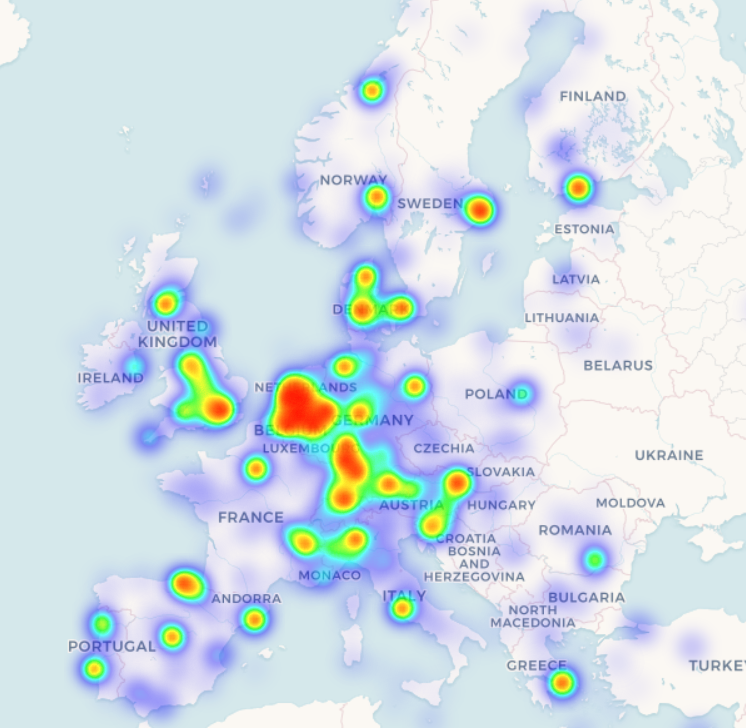
The European Union (EU) has made great efforts to support Smart Grid Projects and since the year 2002 there have been over 950 projects with a total investment of 5 billion euros. The domains with the highest investment are smart network management, demand-side management and integration of distributed generation and storage, together accounting for around 80 % of the total investment (Gangale F.&al. 2017). Smart energy systems will be in the focus of EU funding and furthermore the horizon 2020 program (European Commission 2017) will provide good opportunities to get external finance in collaboration with domestic and international universities and research institutes. Vaasa region in Finland is the Nordic center of energy industry and the city of Vaasa is also strong regarding the number of operating universities and university students. For the local universities it is focal how closelythey can collaborate with the regional energy industry. During the past decades, the local energy industry has shown great willingness to both assist and collaborate with different universities within Vaasa Region. For successful collaboration, the capability to listen to and understand the needs of the local energy industry is vital. In the best-case scenario, there are mutual benefits inthe collaboration when the industry can provide insights for the universities and they again, on their part can disseminate information from the academic world to the companies. Smart Grid R&D-projects between the local industry and universities provide great opportunities for closecollaboration, which can in the future make the Vaasa region glowin red color in the Smart Grid heat map by the European Union (Figure 3).