
First, we must have a research problem to which we want an answer. Then we collect data when conducting quantitative research. Data are numbers that have some meaning. Those numbers might represent example age, exam marks, work, or indeed almost anything you ask for. (Brace, Kemp & Snelgar 2003, 4). Today, it is also essential to remember, if you do process personal data in your assignments or thesis, data protection (Mannila 2021). Note that the processing of personal data is governed by Data Protection Legislation EU GDPR 2016/679, as well as Finnish Data Protection Act 1050/2018, and some other special legislation.
As Brace, Kemp & Snelgar (2003, 4–5) emphasize, it is very important to think about the types of scales we might use and the data that results from, their use. Note that before you enter your data into SPSS, it is important to think about what the numbers in our data file mean. Numbers, with which the data have been collected, can be dived into four different types, which are nominal data, ordinal data, interval data, and ratio data.
There are also other ways of classifying data. Another classification system is continuous: discrete and categorical. For a continuous scale, the data points can have fractional values, whereas for a discrete scale the data points have to be integers (whole numbers). Both continuous and discrete can be of ratio, interval, or ordinal level of measurement. (Brace, Kemp & Snelgar 2003, 6–7.)
Figure 1 shows the Types of Measurement Scales. You find out that figure, that nominal scale used to label variables in different classifications and does not imply a quantitative value or order.
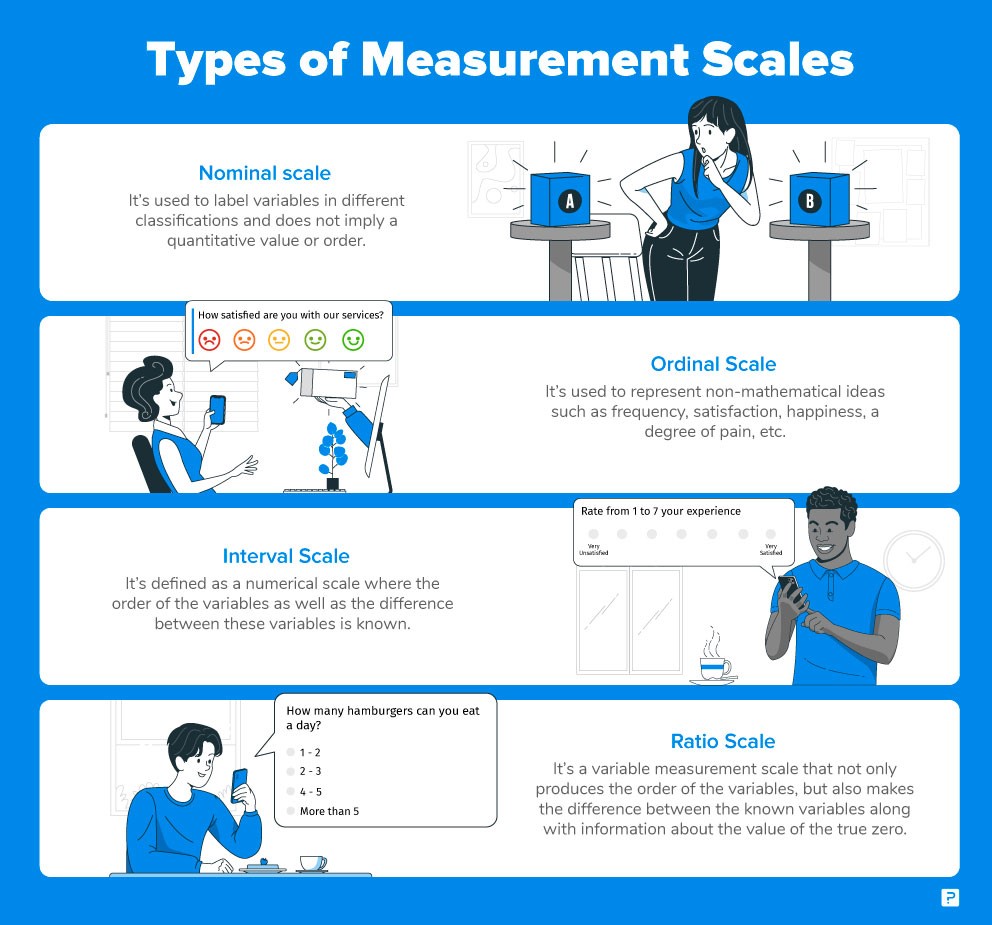
Nominal variables are numbers named variables example 1 = Male, 0 = Female or you can also ask e.g. what is your eye color?. 1= brown, 2= blue, 3= grey, 4 = green, 5 = other (Nominal, Ordinal, Interval, Ratio Scales with Examples).
Ordinal scales have been used to represent non-mathematical ideas such as frequency. Typically, this is used to rank or order variables such as grades, satisfaction, or happiness. You can ask e.g. how satisfied you are with our services? or are you happy today? (Nominal, Ordinal, Interval, Ratio Scales with Examples; Brace, Kemp & Snelgar 2003, 6–7.)
Interval scale we know that 3 is more than 2 or 4 is less than 5. We can ask for incomes, temperature, experience, attitudes, etc. Maybe you have heard to speak about the Likert scale, which is known interval scale. (Nominal, Ordinal, Interval, Ratio Scales with Examples.)
Fourth is Ratio Scale. It is defined as a variable measurement scale that not only produces the order of variables but also makes the difference between variables known along with information on the value of true zero. You use a ratio scale when answers are presented between categories such as what is your age? 30–34; 35–39; 40–44; 45–50. (Nominal, Ordinal, Interval, Ratio Scales with Examples.)
Summary
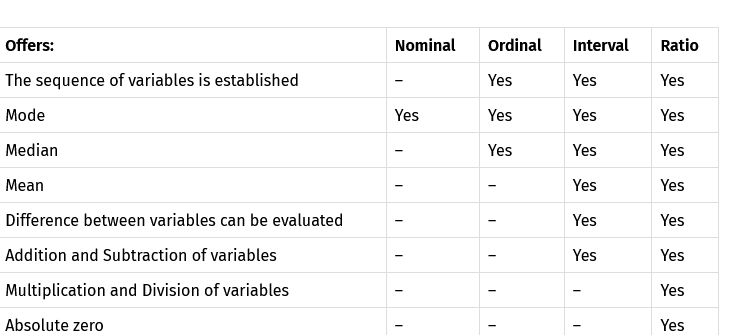
When you are planning your first quantitative research and think about how it works and how you can analyze the collected data: You can find out the four data measurement scales below the easy-to-remember chart in Figure 2. Maybe this chart helps you find a method to help you structure the data you collect.
Attend research courses and dare to ask when you do not understand something. Also actively search for more information on the topic yourself. Read research papers and thesis around your topic, I am sure you find out answers to how to conduct your very own research.