Introduction
The estimation of annual wind energy production is a critical component in determining the project finance of wind turbines. The life cycles of wind farms are usually 20-25 years, so providing estimates of annual energy production for the duration of the project can be challenging and can impact the profitability of wind projects. The estimation of wind energy production requires a level of prediction based on historical data, which can be difficult in estimating energy production losses and uncertainties over the life cycle of the project. For example, Halberg (2017) indicates that reducing energy uncertainty by 1% can lead to economic benefits of 500,000 to 2,000,000 US depending on the size of project and on the financial model. The goal of this paper is to present a summary of energy loss and uncertainties to assist students in wind project financing model.
The structure of the paper is presented as follows: First, probability distributions of energy production over the life cycles of a wind turbine is presented, and the production loss and uncertainties of wind energy production is summarized. This is followed by a demonstration exercise and conclusions.
1. Wind Energy Distribution
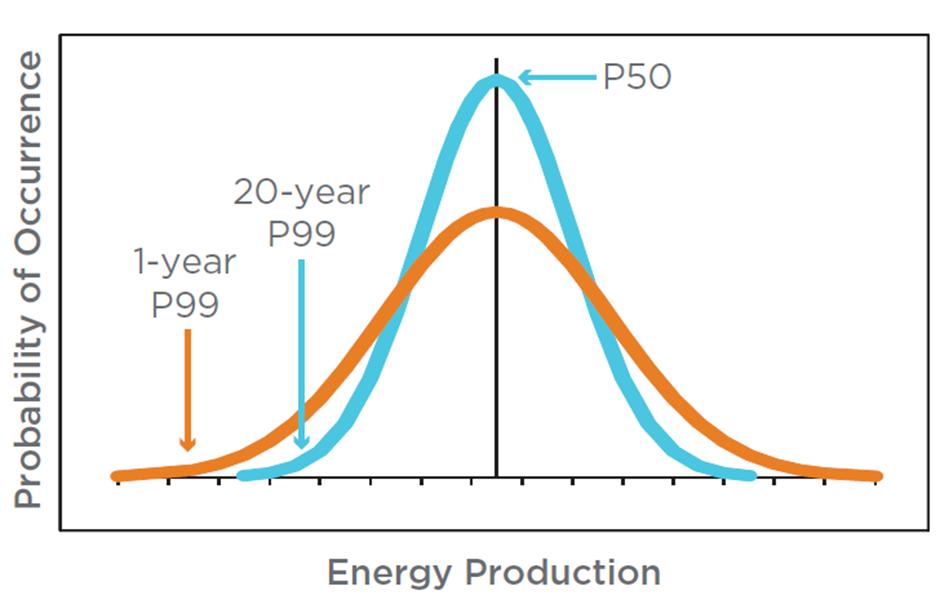
Wind resource assessment is an uncertain process, and a variety of factors from wind speed measurement errors to the inherent physical variations in the wind contribute to uncertainties (Lackner, 2007). These uncertainties affect the probability distribution of expected energy production in terms of standard deviations and the profitability of wind project. The basis for modelling expected production is based on a statistical approach and provides a comparable estimation of expected production and production uncertainty. The expected yearly production of a wind farm is called the P50, and this is the production level which is exceeded with a probability of 50% used to determine the uncertainty in the production forecast. Figure 1 shows both the one-year and 20- year probability distributions for a typical project (KEMA, 2012). The blue curve is a 20 year curve, and the P50 energy production level is the central energy production estimate. The P99 level shows an energy production level that has a 99% probability of exceedance over the life of the project. The orange one-year curve represents the values for any one year within the 20-year project life (KEMA, 2012).
The shape of these distributions is determined by the energy assessment uncertainties and the variability of the wind resource. The wider the spread between the P99 and the P50, the wider the distribution, and the more uncertain the energy estimate. The twenty-year average values are less uncertain than the one-year values because the variability inherent in the one-year values is averaged out over the long term. P50 level of confidence may represent too high a risk for some investors. Therefore, other probabilities of exceedance, such as P90 (estimate exceeded with 90% probability) or P75 (estimate exceeded 75% probability of the time) are considered. Lenders and investors typically use P90 estimates to be confident that sufficient energy is generated, allowing to safely repay the project debt.
For example, Px denotes the annual energy production level that is reached with a probability of x%. Hence, P95 means that there is a chance of 5% that the P95 level will not be reached. P50 of course is the base case, as there is a 50:50 chance it will be exceeded . P-value is expressed as in equation 1:
P value = (1-Probability) (1)
With the 𝑃50 value, the total uncertainty of the project and the z table probability, it is possible to determine the value of the net energy production for the desired probability of exceedance (see Equation 2, Lira et al. 2016 ).
𝑃𝑥= 𝑃50∗(1−𝑧∗Total Uncertainty) (2)
Where 𝑃𝑥 is the net energy production to the desired probability of exceeded, and the total uncertainty is the total project uncertainty. Z is the value for the desired probability table. Table 1 shows z values for various probability levels.
| Probability of exceedance (%) | Z |
|---|---|
| 99 | 2.326 |
| 95 | 1.645 |
| 90 | 1.282 |
| 85 | 1.036 |
| 84 | 1.000 |
| 80 | 0.842 |
| 75 | 0.674 |
| 50 | 0 |
| 25 | 0.674 |
| 10 | 1.282 |
| 1 | 2.325 |
In summary, the following simplified steps are used to determine the net energy production for the desired probability of exceedance:
- Calculate the gross annual energy production (AEP) based on your wind measurement, long time correction, theoretical power curve of the selected turbine model,and wind analysis
- Subtract the losses from Gross AEP to determine the Net AEP (P 50)
- Subtract the uncertainties Net AEP to get the P- 75/84/90/99 value
2. Losses and Uncertainties in Wind Energy Production
The main sources of uncertainties can be categorized into two groups, and energy production uncertainty, and wind resource uncertainty. The power curve of a wind turbine determines the power output for each specific wind speed, and it is the key parameter for estimating energy production. Factors such as turbulence and topography can play a critical role in the variation of the power curve wind turbine (Lira et al. 2016).
Wind resource uncertainty is related to the limitations in the measurement process, such as the use of anemometers and wind vanes mounted on met masts to measure wind speed and direction, and remote sensing technology. Based on the literature review (Lee and Fields, 2020; KEMA, 2012), a summary of the sources of energy production losses and uncertainties related to wind resource assessment are presented in Tables 2 and 3. See Lee and Fields (2020) for description of subcategories of the different types of energy production losses and uncertainties related to wind resource measurements.
| Types of energy production losses | Description | Average | Typical range |
|---|---|---|---|
| Total Wake effect | Wake internal, external, and wake effects that will affect future energy production | 6.5% | 1.0-20.0% |
| Availability | Consisting of warranted availability, site access, downtime, grid outage, availability of substation, and other non-turbine availability | 4.4% | 0.3-11% |
| Total Electrical | Electrical losses between low or medium voltage side of the transformer of wind turbine and energy measurement point, extreme weather affecting the turbine | 1.32% | 0.0-3.5% |
| Turbine performance | performance deviations from optimal wind plant performance, deviations between estimated power curve and actual performance, Losses due turbulence intensity, density, shear measurements, Energy loss in hysteresis loop between high wind speed cut out and recut in speed. | 17.9% | 2.0-37.0% |
| Environmental | Low performance due shutdown caused by icing, blade fouling, and efficiency losses, due high temperature, lighting, etc, Tree growth, building development | 1.2% | 1.0-6.0% |
| Curtailment | Wind speed/direction curtailments to mitigate loads, offtake agreements, Birds, bats, flicker, noise, Downtime not mentioned in power curves | 1.23% | 0.0-5.0% |
| Types of wind resource uncertainties | Description | Average | Typical range |
|---|---|---|---|
| Accuracy of measurement . | The uncertainty in the accuracy of the measurements | 2.4% | 1.5-3.5% |
| Vertical Extrapolation | The uncertainty associated with extrapolating measurements to the turbine hub height and across the turbine rotor | 2.0% | 1.0-3.0% |
| Horizontal Extrapolation | The uncertainty associated with extrapolating measurements to the turbine hub height and across the turbine rotor | ||
| Historic wind climate | The uncertainty of estimating the long-term wind resource based on a short on-site measurement period (typically, 1 to 4 years) | 2.3% | 1.5-4.0% |
| Future variability | The variability in the wind resource due to statistical uncertainty related to wind resource during modelled operation period | 2.1% | 1.0-3.0% |
| Energy Losses | The uncertainty associated with estimating energy losses, turbine availability, performance issues, wake losses, environmental and electrical losses | 2.0% | 1.0-3.0% |
| Spatial Variability | The uncertainty associated with estimating the wind resource at each turbine location and wind flow modelling. | 2.0% | 1.0-1.3% |
3.Demonstration of Calculation of Uncertainties and Energy Production
We assume a 4.26 MW wind turbine (Enercon) with an average wind speed of 7m/s and annual energy production of 14030 MWh (Renewables First, n.d). The assumptions for losses and uncertainties are presented in Tables 4 and Tables 5 for demonstration purposes. Results are presented in Table 6 and 7.
| Wake losses | 6.5% |
| Turbine availability | 2.0% |
| Grid unavailability | 0.5% |
| Electrical losses affecting the wind farm | 2.0% |
| Electrical losses affecting transmission | 1.0% |
| Environmental icing | 6% |
| Curtailment | 2% |
| Total Losses | 20% |
Source: Own elaboration
| Accuracy of measurement | 2.4 % |
| Vertical Extrapolation | 2.0% |
| Horizontal Extrapolation | 1.5% |
| Historic wind climate: | 2.0% |
| Future variability | 2.1% |
| Energy Losses | 4% |
| Spatial Variability | 3% |
| Total Uncertainties | 16.0% |
Source: Own elaboration
| Case 1 (P50) | Case 2 (84) | Case 3 (P90) | |
|---|---|---|---|
| Gross Annual Energy Production (MWh | 14,030 | 14,030 | 14,030 |
| Losses (20%) | 2806 | 2806 | 2806 |
| Net annual Energy Yield (P50) | 11224 | 11224 | 11224 |
| Uncertainties (16%) | 1795,8 | 1795 | |
| P yield: 𝑃𝑥= 𝑃50∗(1−𝑧∗Total Uncertainty) | 9428 | 8923 |
The results indicate that annual energy production for P84 and P90 are 9428 MWh and 8923 MWh respectively. A 1% improvement in both the energy production losses and wind resource uncertainties increases net annual energy production by 2.5% from P84 (9428 MWh) to P85 (9660 MWh), and 2.9% for P90 (from 8923 MWh to 9182 MWh). (see Table 7)
| Case 1 (P50) | Case 2 (85) | Case 3 (P90) | |
|---|---|---|---|
| Gross Annual Energy Production (MWh | 14,030 | 14,030 | 14,030 |
| Losses (19%) | 2667 | 2667 | 2667 |
| Net annual Energy Yield (P50) | 11363 | 11363 | 11363 |
| Uncertainties (15%) | 1704 | 1704 | |
| P yield | 9660 | 9182 |
4. Conculsions
This article provides a summary of losses and uncertainties in estimating the net energy production of wind energy to determine the P values. Decreasing losses and uncertainties and improving the criteria design can improve financial viability of wind farms, and their role in clean energy transition plan. It is vital to recognize the main sources of losses uncertainties in a wind farm project in order to reduce their impact and then accurately determine their impact on energy yield forecasts. With the new innovative wind measurement technology approaches, such as remote sensing, SoDAR (sonic detection and ranging) and LiDAR (light detection and ranging), the wind industry is striving to reduce uncertainties to maximize energy production and benefits for both project owners and financiers. More studies are needed to evaluate the cost benefits of adopting a technology to reduce uncertainties and their impact on financial metrics such as net present value, and debt service cover ratio.